

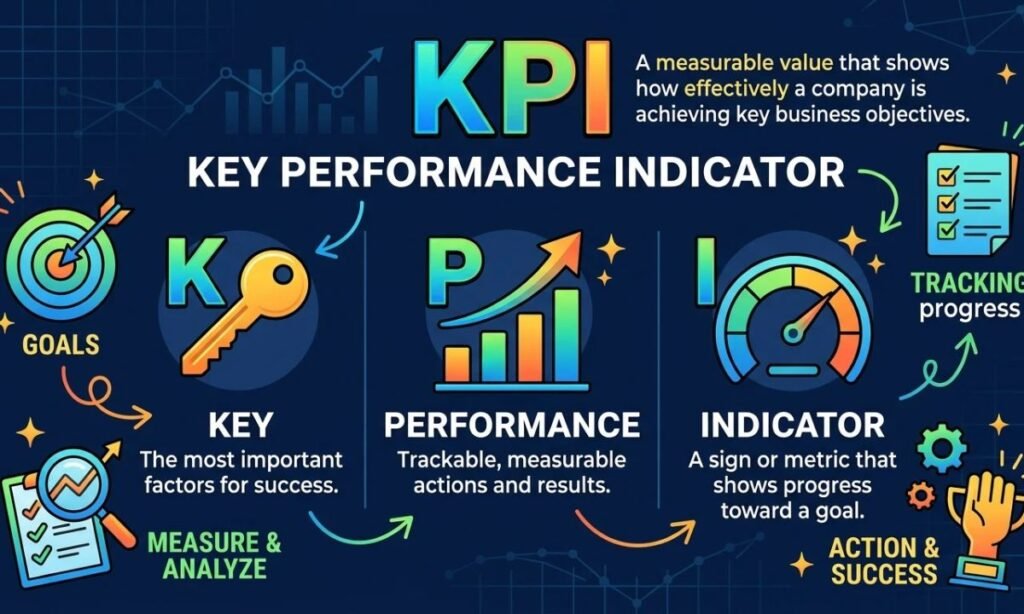
Understanding the KPI meaning helps business owners, managers, and employees see whether their work is producing the intended results. KPI stands for Key Performance Indicator, a measurable value that shows progress toward a specific business objective. Instead of relying on assumptions, companies use KPIs to evaluate performance, recognize problems, and decide where improvements are needed.
The KPI meaning becomes clearer when you look at real workplace situations. A sales team may measure monthly revenue, a marketing department may track qualified leads, and a factory may monitor product quality or machine downtime. Although these indicators differ, they serve the same purpose: connecting business goals with measurable results. Choosing the right indicators can make performance reports more useful and help teams focus on the work that matters most.
What Is a KPI?
A key performance indicator is a measurable value used to determine how effectively a person, team, department, or organization is moving toward a defined goal. The KPI meaning is not simply about collecting numbers; it is about understanding whether important objectives are being achieved.
For example, imagine a delivery company that wants to improve customer satisfaction. It might measure the percentage of orders delivered by the promised date. If its target is 96% and the actual result is 89%, the difference signals that the company should investigate delays and improve its delivery process.
KPIs can be used at different levels:
- Strategic KPIs: Measure major business outcomes, such as annual revenue growth.
- Operational KPIs: Track everyday processes, such as order processing time.
- Departmental KPIs: Evaluate results within sales, marketing, finance, or production.
- Individual KPIs: Measure performance linked to an employee’s responsibilities.
A well-designed indicator has a clear definition, a reliable data source, a target or comparison point, and an owner who reviews the result. These elements help turn performance information into practical decisions.
KPI vs. Metric
A metric is any measurable value that helps describe an activity or result. A KPI is a metric selected because it directly relates to an important objective. Understanding this difference is an essential part of the KPI meaning, particularly when building business dashboards or performance reports.
| Comparison | Metric | KPI |
| Main purpose | Measures an activity or result | Tracks progress toward a key goal |
| Connection to goals | May be indirect | Directly linked to an objective |
| Target | Optional | Usually includes a target or benchmark |
| Example | Number of customer calls | Percentage of calls that result in sales |
| Use | Monitoring and analysis | Evaluating important business performance |
Consider an online store that receives 20,000 website visits in a month. Traffic is a useful metric, but it does not show whether visitors are buying products. If the company’s objective is to increase sales, its purchase conversion rate may be a more relevant KPI.
Metrics still matter because they can explain why a KPI changes. The key is to distinguish the numbers that support analysis from the indicators that deserve regular management attention.
5 Traits of a Good KPI
A useful KPI should make performance easier to understand and improve. The KPI meaning becomes valuable in practice when the chosen indicator helps people identify progress, understand problems, and decide what to do next.
1. It Is Tied to a Goal
Every KPI should support a specific business objective. If a company wants to reduce customer complaints, it could track the complaint rate or the percentage of issues resolved within an agreed timeframe. The connection between the indicator and the goal should be clear enough that employees understand why the measurement matters.
2. It Has an Owner
Each KPI should have a person or team responsible for reviewing the result and coordinating follow-up actions. Ownership creates accountability without assuming that one individual controls every factor affecting performance. When results fall below expectations, the owner should know who needs to investigate the issue and when progress will be reviewed.
3. It Has a Clear Formula
A KPI must be calculated consistently. For example, a company measuring its employee turnover rate should define the reporting period, the employees included, and the method used to calculate the rate. Without an agreed formula, different departments may report different results for the same measure, making comparisons unreliable.
4. It Shows a Trend
One result rarely explains the full situation. Comparing performance across several periods helps managers understand whether a problem is improving, worsening, or remaining stable. A trend also provides context when seasonal demand, staffing changes, or unusual events affect the latest figures.
5. It Leads to Action
A KPI should help someone make a decision or investigate a meaningful change. If a factory notices that its defect rate has increased, the production team might examine raw materials, equipment settings, or inspection records. If a measurement never influences a decision, it may be better treated as a supporting metric rather than a primary KPI.
KPI Examples for Different Departments
The most suitable KPIs depend on what each department is expected to achieve. Applying the KPI meaning correctly requires selecting measurements that reflect actual results rather than simply counting how much work has been completed.
| Department | KPI example | Purpose |
| Sales | Monthly revenue | Measures sales performance against a target |
| Marketing | Lead conversion rate | Measures how effectively leads convert |
| Manufacturing | First-pass yield | Measures the percentage of units passing inspection without rework |
| Customer service | First-response time | Tracks how quickly customers receive an initial response |
| Finance | Operating profit margin | Measures operating profit relative to revenue |
| Human resources | Employee turnover rate | Tracks employee departures over a defined period |
These are examples, not universal standards. Each organization should establish targets based on its business model, historical results, customer expectations, and operating conditions.
Sales KPI Example
Suppose a company sets a monthly sales revenue target of $80,000. At the end of the month, its sales team generates $72,000. The team achieves 90% of its target, leaving an $8,000 gap that requires investigation.
The sales manager might review the number of qualified leads, proposal acceptance rate, average order value, and sales cycle length. These supporting metrics help explain the revenue result and identify changes that could improve future performance.
Manufacturing KPI Example
A factory produces 2,000 units during a shift, and 1,900 pass inspection without requiring rework. Its first-pass yield is 95%, calculated by dividing 1,900 by 2,000 and multiplying by 100.
If the target is 98%, the production team can examine defect categories, machine conditions, operator training, and material quality. The result becomes useful when it guides a specific investigation rather than simply appearing in a daily report.
Marketing KPI Example
A marketing team generates 150 qualified leads from 5,000 website visitors during a campaign. Its lead conversion rate is 3%, assuming the company defines qualified leads and visitors consistently.
The team can compare campaigns, landing pages, and traffic sources to determine which activities attract relevant prospects. This provides a stronger basis for improving marketing performance than relying on website traffic alone.
Find Out Which KPIs Will Work Best for Your Company
Choosing suitable indicators begins with the result your company wants to achieve. The KPI meaning should always be connected to your organization’s priorities, available information, and ability to influence the measured outcome.
Use these questions to select your KPIs:
- What needs to improve? Define a specific business objective before selecting a measurement.
- Which result demonstrates progress? Choose an indicator that reflects the objective clearly.
- What is the current performance level? Establish a baseline using reliable historical data.
- Who can influence the result? Assign an owner who can investigate changes and coordinate improvements.
- How often should it be reviewed? Choose a reporting frequency that matches the speed of the process.
- What action follows a poor result? Decide in advance how the team will respond when performance misses its target.
For many teams, beginning with three to five primary KPIs per objective is manageable. Supporting metrics can remain available for deeper investigation without crowding the main dashboard. The right number depends on the complexity of the work and whether each indicator contributes useful information.
KPI Report: What Should It Include?
A KPI report organizes performance information so managers can quickly understand results and decide where attention is needed. It should explain the difference between expected and actual performance rather than presenting unexplained numbers.
A practical report includes:
- KPI name and definition: Explains exactly what is being measured.
- Target: Shows the intended level of performance.
- Actual result: Displays the latest measurement.
- Reporting period: Identifies the dates covered.
- Variance: Shows the difference between the actual result and the target.
- Historical trend: Compares results with earlier periods.
- Data source: Identifies where the information originated.
- Owner and next action: Shows who will investigate or improve the result.
A well-organized report also explains unusual changes and data limitations. Charts can help readers recognize trends, but every visual should have clear labels and enough context to prevent misleading interpretations.
KPI Report Example
Imagine a fictional online retailer reviewing its monthly performance. The following example demonstrates how a report can distinguish successful results from areas requiring attention.
| KPI | Target | Actual result | Interpretation |
| Monthly revenue | $80,000 | $72,000 | Below target |
| Purchase conversion rate | 3.0% | 3.4% | Above target |
| On-time delivery | 96% | 91% | Below target |
| Product return rate | 5% or less | 4.2% | Within target |
The retailer has exceeded its conversion target, but revenue and delivery performance remain below expectations. Management should investigate whether lower average order values, inventory shortages, or delivery delays contributed to these results instead of assuming that one factor explains everything.
Each follow-up action should have a responsible owner and a review date. The next report can then show whether the investigation led to measurable improvement.
Common Mistakes When Setting KPIs
Businesses sometimes struggle with performance measurement because their indicators are poorly defined, excessive in number, or disconnected from decisions. Avoiding these common mistakes makes a KPI system more reliable and easier to maintain.
Too Many Indicators
Tracking dozens of primary indicators can overwhelm employees and hide the measurements that matter most. Keep the main report focused on important objectives, and use supporting metrics when deeper analysis is needed.
Measuring Activity Instead of Results
The number of emails sent or meetings attended may indicate activity, but it does not automatically demonstrate success. Combine activity measures with outcomes such as revenue generated, customer satisfaction, or reduced processing time.
No Single Definition
If teams use different formulas, reporting periods, or inclusion rules, their results cannot be compared fairly. Document the calculation method and data source for every KPI, and make the definitions accessible to everyone who uses the report.
Manual Reporting
Repeated manual data entry can cause errors and delay decisions. Where practical, automate data collection and calculations through reliable business systems. Automation still requires validation because missing records, incorrect integrations, and inconsistent source data can affect reported results.
How to Implement KPIs Step by Step
Implementing KPIs does not require a complicated dashboard from the beginning. A structured process helps organizations establish meaningful measurements, clarify responsibilities, and improve reporting over time.
1. Choose One Goal
Start with one business objective that matters now, such as reducing production waste, improving customer retention, or increasing monthly revenue. A clear goal makes it easier to decide which measurements deserve attention.
2. Choose 3 to 5 KPIs
Select a manageable group of indicators that collectively show progress toward the goal. Avoid including measurements simply because the data is available or another company uses them.
3. Set Definitions
Write down each indicator’s formula, target, baseline, data source, reporting period, and owner. Agree on these details before comparing results across teams or locations.
4. Prepare a Simple KPI Report
Display the target, actual result, variance, and historical trend in a clear format. Include short explanations for important changes and identify any actions that require follow-up.
5. Discuss Only Deviations
Focus review meetings on results that differ meaningfully from expectations. Investigate the causes, agree on corrective actions, and assign deadlines rather than spending the meeting reading every number aloud.
6. Remove Indicators That Do Not Help
Review the KPI list regularly. Remove measures that no longer support the objective, cannot be measured reliably, or fail to guide decisions. Update the system when business priorities or processes change.
KPIs in Manufacturing: When a Report Is No Longer Enough
Manufacturing operations often need more than a monthly summary to understand performance problems. A report might show increased downtime or declining product quality, but additional production data may be necessary to identify the machine, shift, material, or process responsible.
Common manufacturing indicators include overall equipment effectiveness (OEE), first-pass yield, scrap rate, cycle time, throughput, unplanned downtime, and on-time delivery. These measures cover different aspects of production and should be interpreted in context. Higher output, for example, is not necessarily an improvement if defects and rework increase at the same time.
When a report does not explain a change, managers can examine production records by line, machine, product, or shift. Depending on the facility, manufacturing execution systems (MES), enterprise resource planning (ERP) platforms, and connected equipment data can support more detailed analysis.
The objective is to connect performance results with operational evidence. A useful manufacturing KPI system helps teams identify root causes, prioritize improvements, and verify whether corrective actions produce better results.
What to Do Next
Start by selecting one business objective that needs improvement. Define the expected outcome, identify a suitable indicator, establish a baseline, and agree on a realistic target. Assign responsibility to someone who can review the results and coordinate the necessary action.
Build a simple report that shows actual performance, target variance, and changes over time. Review the information at an appropriate frequency, investigate important deviations, and record the steps taken. As your processes develop, reconsider whether the selected measurements still support your priorities.
The practical value of the KPI meaning lies in connecting measurable results with better decisions. A strong performance system does not simply collect data; it helps people understand what is happening, why it matters, and what they can improve next.
FAQ: What Is a KPI?
What Is a KPI?
KPI stands for Key Performance Indicator, a measurable value used to evaluate progress toward a specific objective.
What Is a KPI in Business?
In business, a KPI measures progress toward an important goal, such as revenue growth, improved customer retention, greater production efficiency, or better product quality.
What Is the Difference Between a KPI and a Goal?
A goal describes the result an organization wants to achieve, while a KPI measures progress toward that result using a defined indicator.
What Are KPI Examples?
Common examples include monthly sales revenue, marketing conversion rate, customer retention rate, first-pass yield, equipment downtime, and operating profit margin.
What Should a KPI Report Include?
A KPI report should include the indicator’s definition, target, actual result, reporting period, variance, trend, data source, responsible owner, and planned follow-up actions.
Let’s Talk About KPIs in Your Manufacturing Process.
Manufacturing KPIs such as OEE, first-pass yield, scrap rate, and downtime help teams evaluate production performance and identify areas for investigation. The most suitable indicators depend on the process, production goals, and available data.
Conclusion
Understanding the KPI meaning helps businesses measure progress, evaluate performance, and make informed decisions. The right key performance indicators connect everyday activities with important goals, whether you want to increase sales, improve customer satisfaction, reduce production waste, or strengthen operational efficiency. By choosing clear indicators, setting realistic targets, and assigning responsibility, teams can focus on results that genuinely matter.
A successful KPI system does not require dozens of measurements or complicated reports. Start with a few meaningful indicators, review their results consistently, and take action when performance falls below expectations. As your business grows, update your KPIs to reflect changing priorities. Ultimately, the purpose of understanding the KPI meaning is to turn reliable data into practical improvements and sustainable business progress.